Response to TCFD recommendations

※ TCFD stands for the Task Force on Climate-related Financial Disclosures. The TCFD was established by the Financial Stability Board at the request of the G20 to discuss how climate-related information disclosures and financial institutions’ responses should be.
Governance and risk management
Responding to climate-related risks and opportunities is one of the key ESG issues we should tackle with
concerted group-wide efforts. Based on this recognition, we have established a Sustainability Committee
(which meets at least twice a year) as an advisory body to the Representative Director & President for the
purpose of promoting sustainability management, including the deliberation and determination of basic
policies and necessary matters relating to such responses.
The Sustainability Committee holds meetings attended by directors in charge of the main divisions and
conducts the planning of measures to address climate-related issues,management of progress toward targets,
materiality assessment of risks, priority setting, and the determination of response measures to be taken
before making reports and recommendations to the Representative Director & President. We have also
established a Risk Committee within the Sustainability Committee as a body to manage relevant risks and
execute tasks in accordance with the instructions of the Sustainability Committee.
The Sustainability Committee is supervised by the Board of Directors, which receives reports and issues
instructions as necessary on important matters deliberated by the Committee to ensure that its decisions
are free from errors.
Strategy
Scenario analysis
We have assessed risks and opportunities that may have an impact on the SUGI Pharmacy Group in reference to, among others, the 1.5°C and 4°C scenarios identified in the IPCC’s Fifth Assessment Report, the IEA WEO NZE scenario, etc., after collecting various parameters based on future forecasts.
-
CO2 emissions (t-CO2) under the assumption of no positive action and when targets are met
Item 2030 CO2 emissions under the assumption of no positive action 225,689 Emissions when 50% reduction in CO2 emissions per store from FY 2014 has been achieved 141,890 *An emission factor of 0.000433 (t-CO2/kWh; national average factor for FY 2022) was used.
*A net increase of 100 per year in the number of stores is assumed.
*Electric power consumption at most recently opened stores was used. (Electric power consumption is higher at these stores.)
*Calculated based on the results of FY 2023. -
Scope of analysis
Business: Drugstore business in Japan
Scope: Stores, procurement, logistics, and consumer behavior
Period: Present through 2030Adopted scenarios
- IEA WEO2022 NZE(1.5℃)
- ■ IPCC 5th Assessment Report, etc.
Assessment results
-
1.5°C scenario
We expect that various transition risks will increase. In this scenario, we expect that countermeasures against climate-related issues will be strengthened and decarbonization will progress. As a result, we expect increases in expenditure due to the introduction and higher rates of carbon taxes and the widespread use of renewable energy.
-
4°C scenario
We expect that physical risks, such as extreme weather, will increase. We expect damage to store operations due to the frequency and intensification of natural disasters caused by climate change. As a result, we expect increases in expenditure for repairs and decreases in sales due to temporary store closures.
-
Common scenario (1.5°C and 4°C)
We expect that changes in consumer preferences and behavior will be influenced by temperature rises. If we are unable to develop and display products that meet customer needs or effectively market services that meet customer needs, opportunity losses may arise. On the other hand, we could take advantage of increases in opportunities if we can capture such needs.
Assessment of risks and opportunities
| Category | Assessment | |||
|---|---|---|---|---|
| Assessment in the world of +1.5°C | Assessment in the world of +4°C | |||
| Transition risks and opportunities | Policies and regulations | Carbon pricing |
Risk: Expenditure will increase following the introduction of carbon pricing. |
Risk: The impact of carbon pricing will be limited. |
|
Risk: Expenditure will increase due to increases in production and procurement costs of products and services throughout the supply chain. |
||||
| Control of CFCs |
Risk: Expenditure will increase due to the introduction of CFC-free equipment at stores. |
ー | ||
| Technology | Logistics efficiency | Opportunity: Expenditure will decrease as a result of more efficient logistics. | ||
| Market | Electricity prices | Risk: Expenditure will increase due to rises in electricity prices. | ||
| Reputation | Customer preferences | Risk: Sales will decrease due to a delay in the provision of eco-friendly products and services. Opportunity: Sales will increase as we develop private brand products that meet the needs for sustainable consumption. | Opportunity: Sales will increase as we develop private brand products that meet the needs for sustainable consumption. | |
| EV charging | Opportunity: The frequency of visits to stores will increase as we enhance the charging environment. | ー | ||
| Physical risks and opportunities | Acute | Drastic increases in extreme weather | Risk: Sales will decrease to a limited extent due to temporary store closures and lower customer traffic. | Risk: Sales will decrease significantly due to increases in temporary store closures and lower customer traffic caused by physical damage to stores. |
| ー | Risk: Expenditure will increase as insurance premiums increase in response to increases in natural disasters. | |||
| Opportunity: Sales of disaster prevention and stockpiling-related products will increase. |
Opportunity: Sales of disaster prevention and stockpiling-related products will increase. Risk: Repair expenses will increase due to physical damage to stores. |
|||
| Chronic | Average temperature | Risk: AC-related expenditure will increase as the temperature rises. | Risk: AC-related expenditure will increase as the temperature rises. | |
| Production and procurement | ー | Risk: Expenditure will increase as purchase costs increase due to lower production of raw materials. | ||
Excerpt from business impact assessment based on scenario analysis Trial calculation of expenditure arising from transition risk (carbon taxes)
Trial calculation of the impact when 50% reduction in CO2 emission from FY 2014 is achieved in 2030. The amount of carbon taxes in 2030 is expected to be approximately 2.7 billion yen.
| Item | Business impact |
|---|---|
| Amount of carbon taxes in 2030 | Approx. 2.7billion yen |
※ In reference to IEA WEO2022 NZE (1.5°C) P465 Table B.2, the amount of carbon taxes in 2030 was set
at 140 dollars/t-CO2.
※ The trial calculation is based on the USD/JPY exchange rate as of March 1, 2023.
Future initiatives
The SUGI Pharmacy Group will implement the following measures to be able to create a sustainable society not only for society but also for the Group itself.
-
Response measures toward the realization of a decarbonized society
Energy saving measures
- Daily operational improvements and awareness of the need for power saving
- Introduction and replacement of energy saving equipment
- Introduction of energy management systems
Energy creation measures
- Installation of solar power generation panels owned by the Company
- Installation of on-site and off-site solar panels on a PPA basis
Other measures to reduce CO2 emissions
- Purchase of non-fossil certificates and green power certificates
- Purchase of CO2-free menu services from electric power companies
- Use of EVs as company cars
-
Response measures toward the realization of a recycling-based society
- Repair and reuse of foldable containers and transportation and delivery equipment
- Reuse of furniture, fixtures and equipment following store renovation or closure
- Monitoring of any abnormal quantity of supplies or inventories at each store and providing guidance
- Development of private brand products with eco-friendly packaging
- Promotion of the “temaedori” (taking from the one in front) campaign to prevent food waste
- Reducing waste by sharing information with our business partners
- Charging for plastic bags
Metrics and targets
| CO2 emission per store reduction targets | |
|---|---|
| FY 2030 | 50% reduction from FY 2014 |
| FY 2050 | Net zero |
-
CO2 emissions Scope 1・2・3
FY FY 2016 FY 2017 FY 2018 FY 2019 FY 2020 No. of stores 1,048 1,105 1,190 1,283 1,391 Emissions (t-CO2) 129,392 119,826 120,826 117,611 126,160 Average per store (t-CO2) 123.5 108.4 101.5 91.7 90.7 FY FY
2021FY
2022FY
2023FY
2024No. of stores 1,483 1,565 1,718 2,185 Emissions (t-CO2) 135,149 138,416 152,791 168,388 Average per store (t-CO2) 91.1 88.4 88.9 92.7
(Note 1)(Note 1) From fiscal year 2024, Scope 1 includes Fluorocarbon Leakage (CO2 Equivalent).
The average per store is calculated based only on the number of Sugi Pharmacy stores (1,815 stores).※ A location-based emission factor (national average emission factor by electric power company) is used.
※CO2 emissions based on the use of gasoline by company cars are calculated on a trial basis based on the pro rata allocation of FY 2020 results using the number of stores (in and before FY 2020).
※CO2 emissions shown in the table above are Scope 1 and 2 emissions (emissions from the Group).
※Calculation logics for tenant shops and some offices are currently under close examination.
*Excludes certain subsidiaries.■CO2 emissions Scope 3
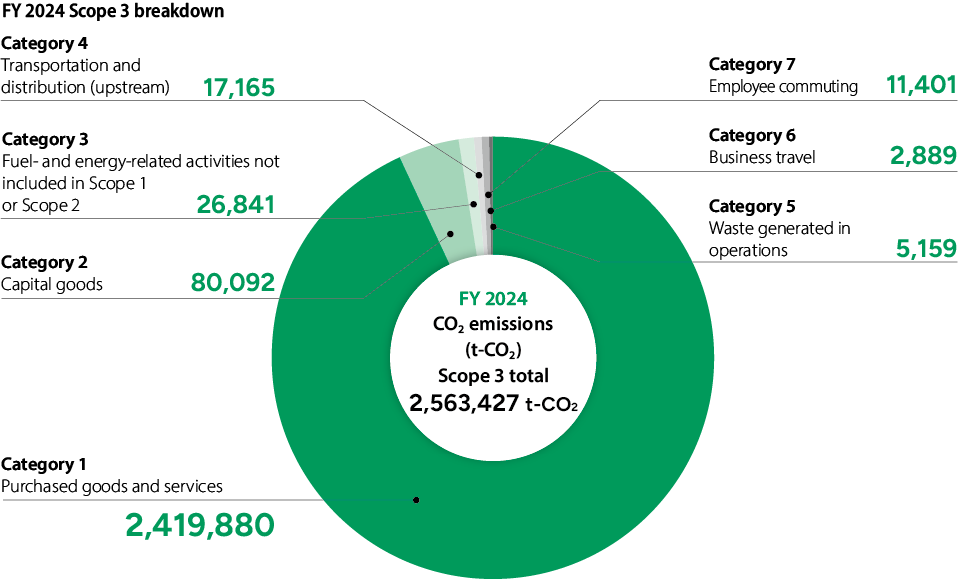
*Categories 8 through 15 are not applicable or items that have not been calculated.
*Category 4 is an estimate calculated based on monthly data over a 12-month period.
*Figures and calculation logics of all categories are currently being reviewed. -
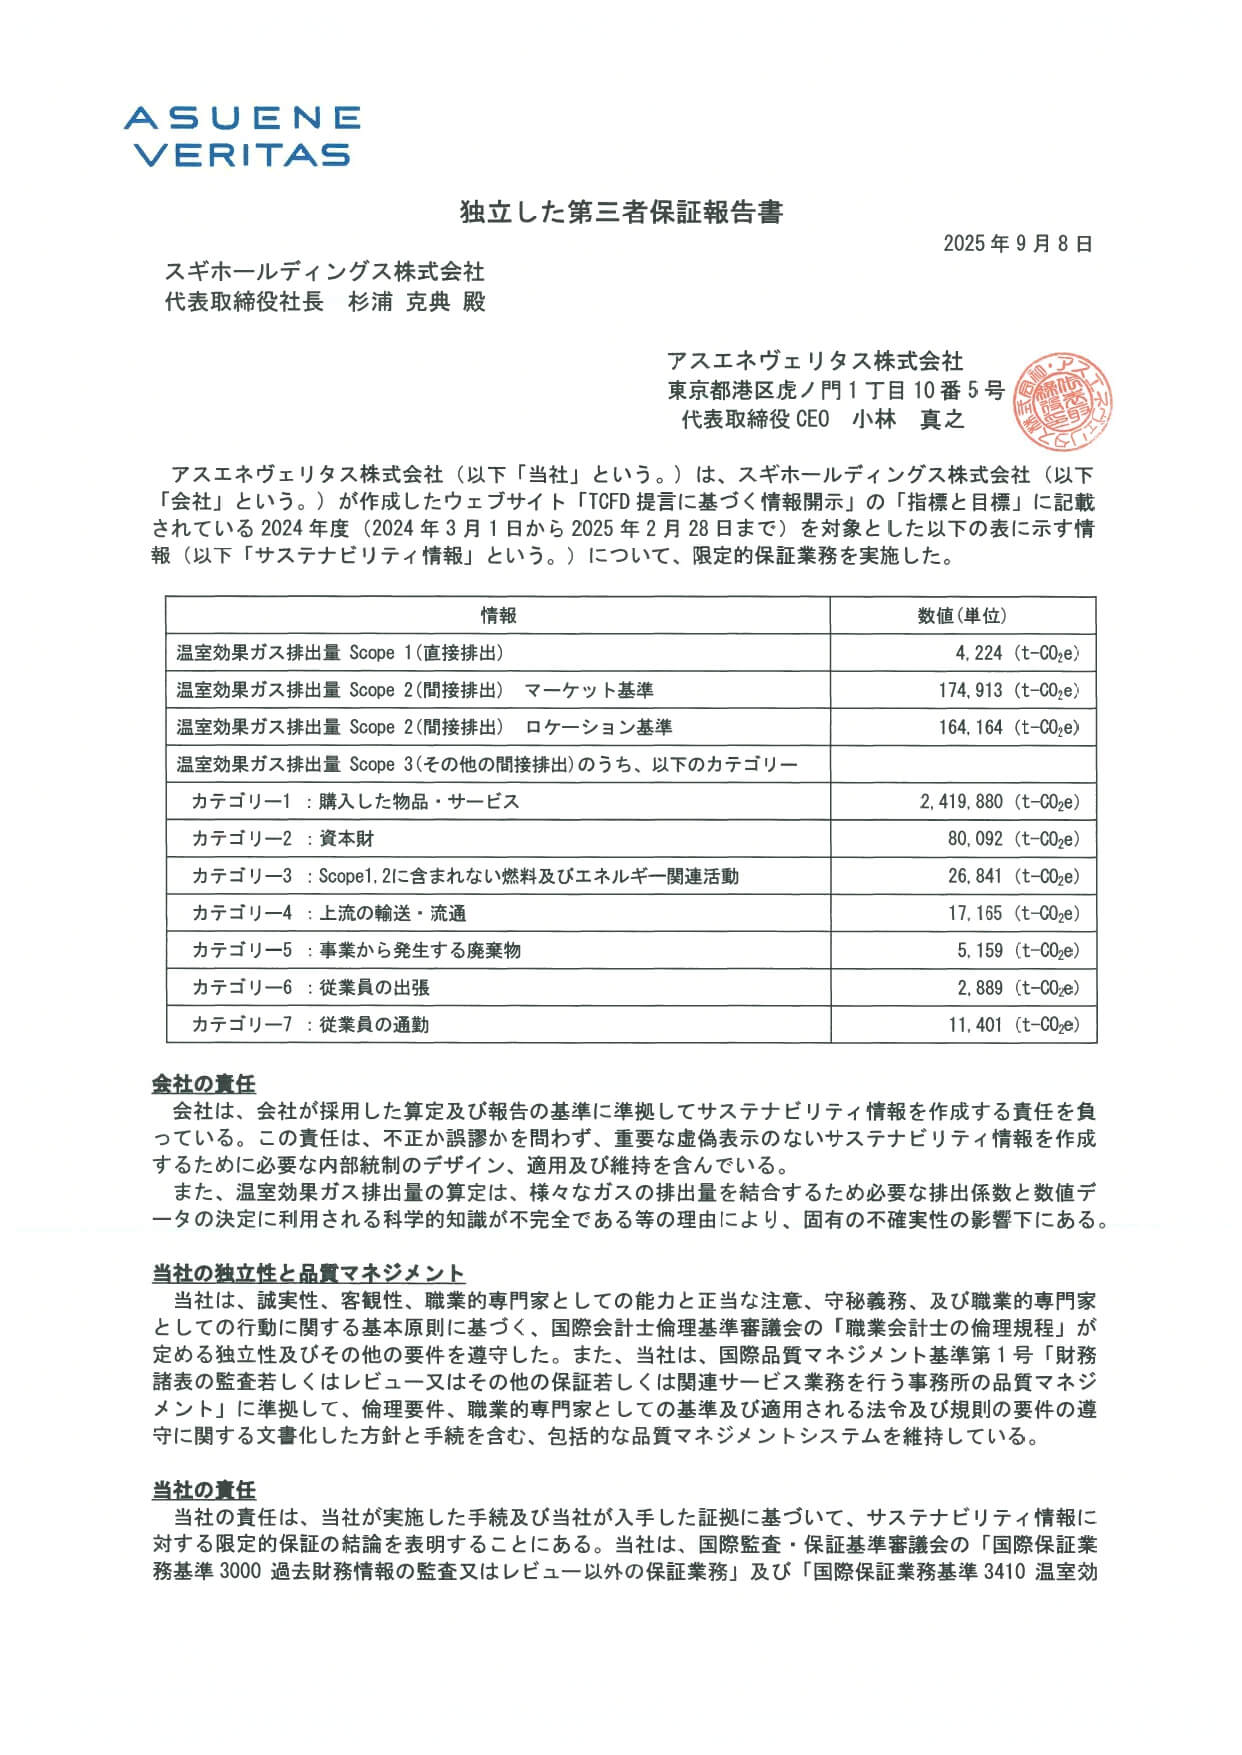
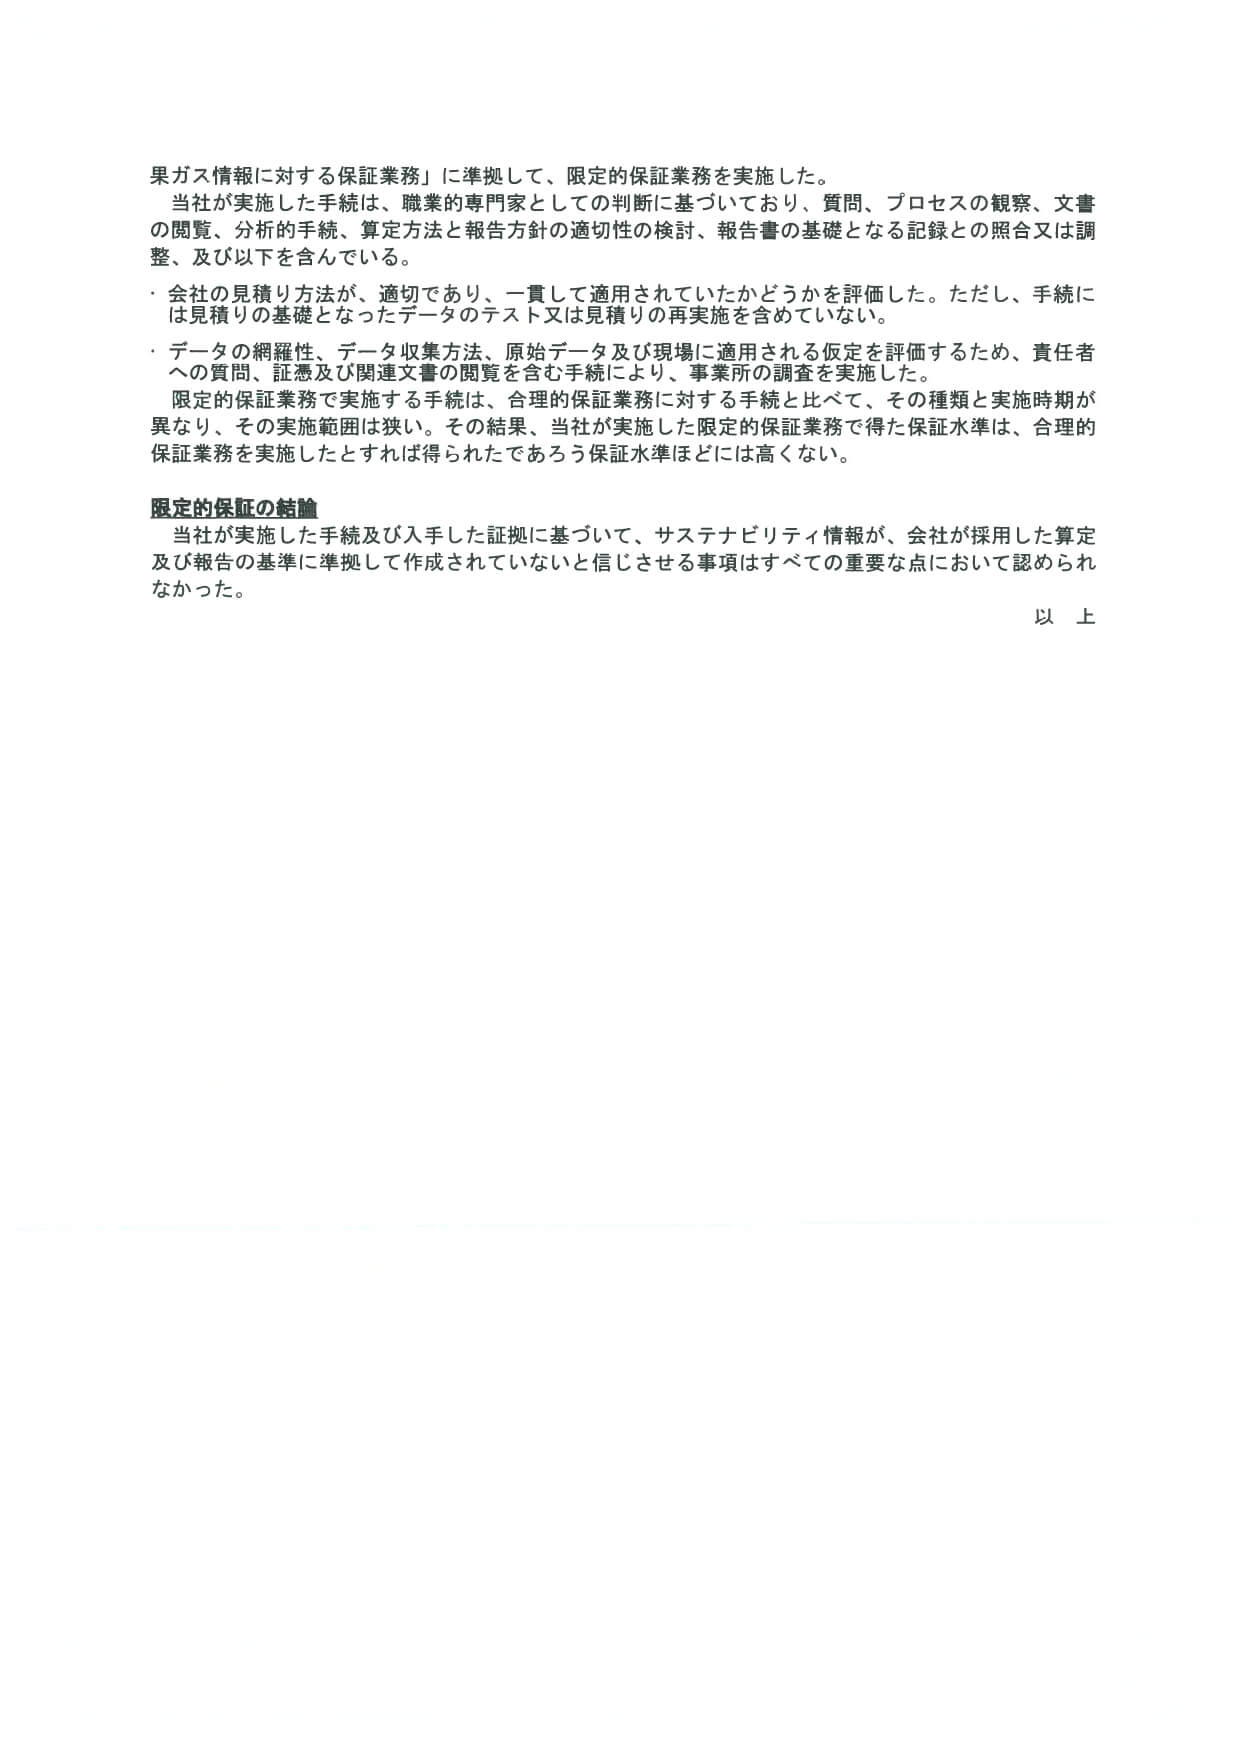
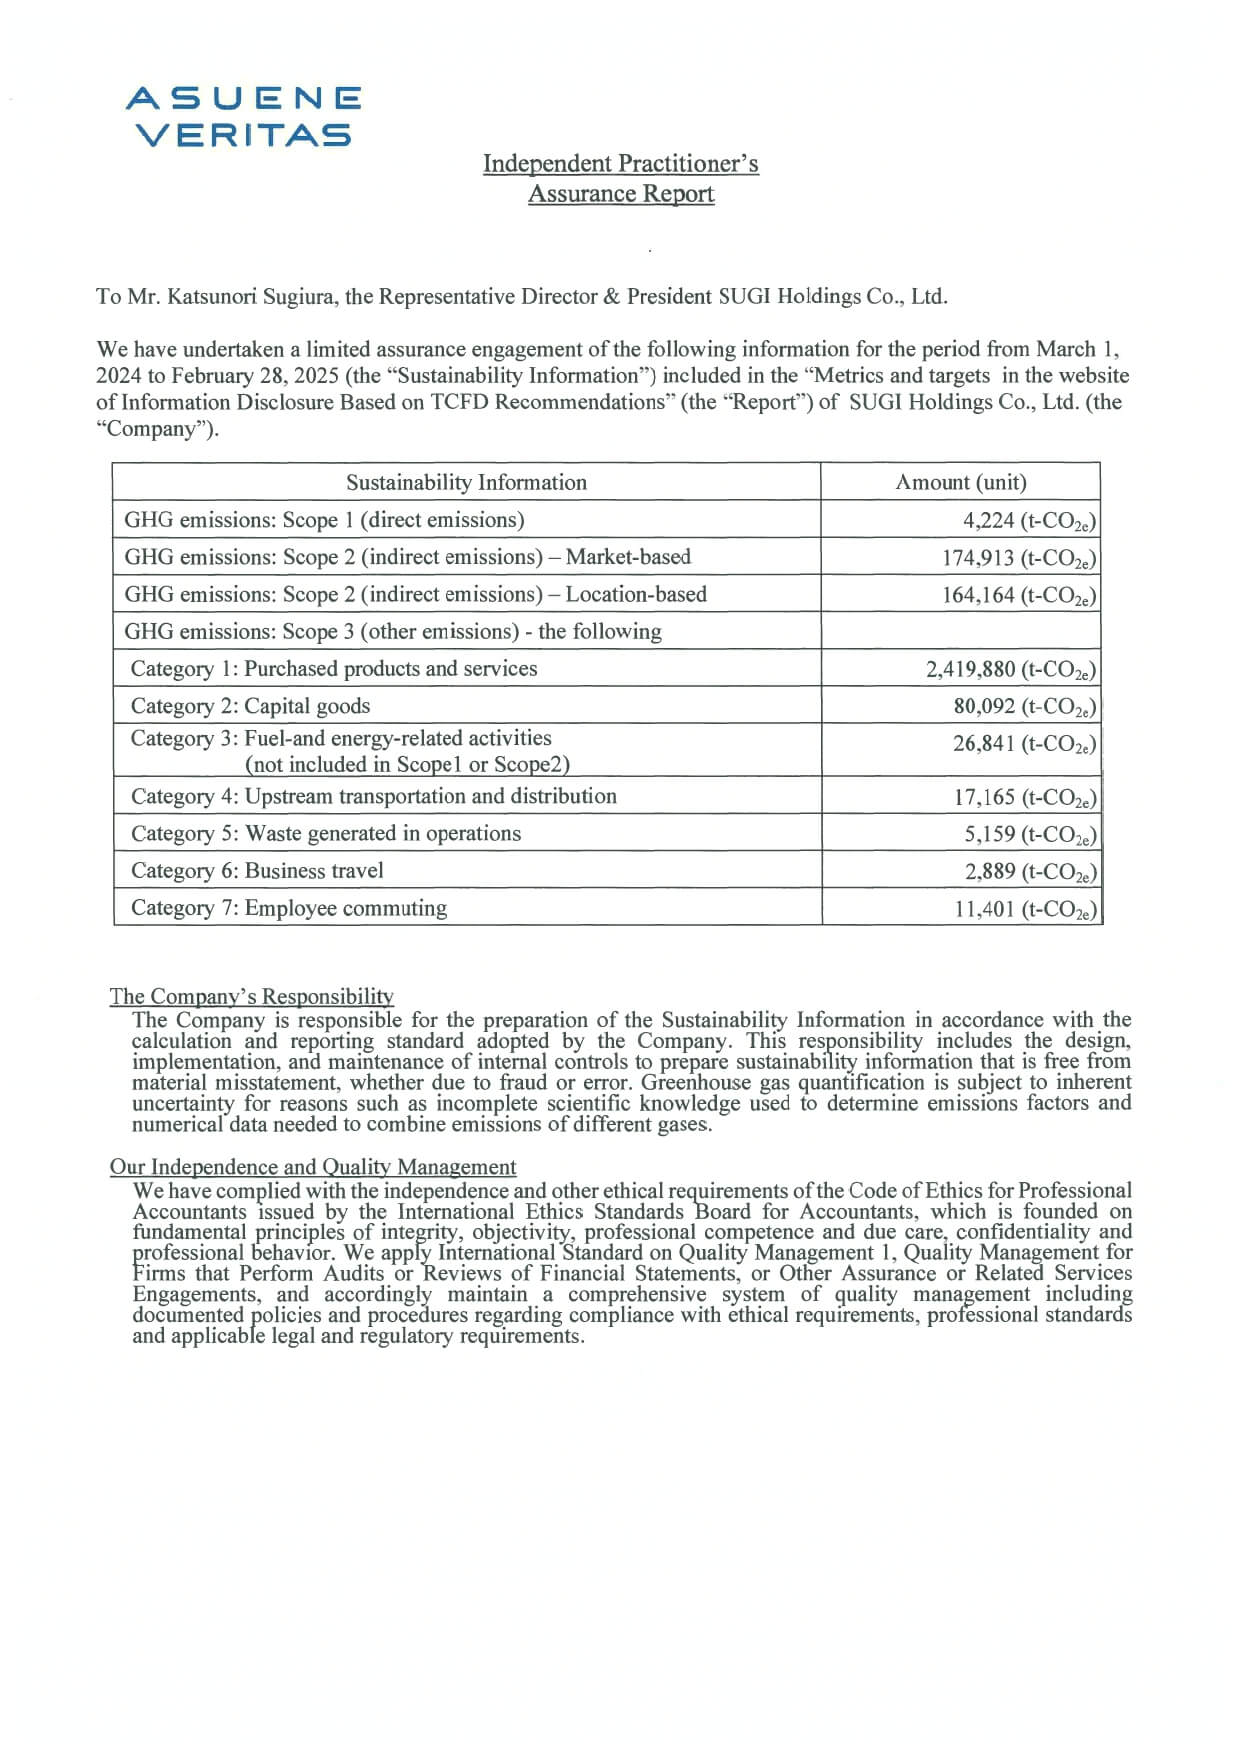
Third-party assurance
Since fiscal year 2023, the Sugi Pharmacy Group has been receiving third-party assurance of CO2 emissions from store operations and business activities, in order to accurately assess and verify greenhouse gas emission calculations.
-
Metrics to measure progress toward the realization of a decarbonized society
- Ratio of reduction in CO2 emissions (Scope 1 and 2) per store
- Ratio of reduction in CO2 emissions from our supply chain (Scope 3)
- Percentage of renewable energy
-
Metrics to measure progress toward the realization of a recycling-based society
- Ratio of eco-friendly private brand products
- Food-loss-and-waste ratio
- Volume of plastic bags used